Workers’ comp cost reduction doesn’t start with your insurer; it starts at the moment of injury. We break down the five variables that drive workers’ comp spend, why most cost reduction occurs in the first 30 minutes after an incident, and the exact intervention framework that HealthcareLive clients use to achieve a 38 to 44% reduction in claim frequency within 12 months. A downloadable cost model is included.
When workers’ comp costs climb, the reflex is almost always the same: call the broker, shop the carriers, renegotiate the policy. It feels like the obvious move, because the premium is the bill you actually see. But it is the wrong lever, and pulling it rarely produces real savings, because your premium is mostly a reflection of your own losses, and a new carrier inherits exactly the loss history the old one had.
The savings you are looking for are real, and they can reach 40% or more, but they do not live in your policy. They live in the first 30 minutes after an injury, in the operational decisions that determine whether a strain becomes a medical-only note or a litigated lost-time claim. You can capture them without changing carriers at all.
This is a long guide because the subject deserves one. We will pull apart how your premium is actually built, walk through the five variables that drive the spend and why your response controls every one of them, explain why the point of injury is the highest-leverage moment in the entire system, lay out the four-part intervention framework HealthcareLive clients use, run the dollars through a worked example, and show how to make the case internally whether you sit in EHS, HR, or finance. By the end, you will be able to model your own savings, and you will understand why almost none of it requires a renewal meeting.
Why switching carriers doesn’t fix the problem
Start with how your premium is actually built, because the whole argument rests on it.
Your workers’ comp cost is, in simplified terms, your manual premium multiplied by your Experience Modification Rate. The manual premium comes from your payroll and your classification codes: the rate per $100 of payroll for each kind of work your people do. That part is largely fixed by what your business is and how many people you employ. The multiplier, your EMR, is where your own history enters the equation, and it is the part you can actually move.
Your EMR compares your actual claim losses to the losses expected for a business of your size, industry, and state. An EMR of 1.0 is average. Below 1.0 is a credit, and you pay less than baseline; above 1.0 is a debit, and you pay a surcharge. An EMR of 1.25 means you are paying 25% more than baseline for the same coverage. And here is the part that matters for the carrier question: the EMR is calculated from your own losses over a three-year window, and that calculation does not care whose name is on the policy. It is portable. It follows you.
That single fact dismantles the shopping strategy. When you move your account to a new carrier to escape high costs, the new carrier rates you on the same loss history that made you expensive in the first place. You have changed the letterhead, not the math. A first-year concession might mask the problem for twelve months, but the underlying mod, and therefore the underlying cost, is unchanged, and it will reassert itself at the next renewal.
It is worth being precise about what a broker and a carrier can and cannot do for you. They can ensure you are correctly classified, which matters because misclassification can inflate your manual premium. They can audit your experience rating worksheet for errors, which can lower your mod if the bureau is using the wrong data. They can shop the market, so you are not overpaying on the controllable margin. Those are real and worth doing. But none of them can lower your DART rate, close your open claims, prevent next quarter’s injuries, or change the trajectory of the strain that happened last Tuesday. Those are the things that actually drive your loss history, and every one of them is operational. It happens on your floor, in your response to injuries, not in a renewal meeting.
There is one more mechanic in the rating formula that explains why operational change is so powerful, and it is worth understanding before we go further. When the rating bureau looks at your claims, it splits each one into primary losses, the portion below a state-specific threshold, and excess losses, the portion above it. Primary losses are weighted at full value because claim frequency is the most stable predictor of future risk. Excess losses are heavily discounted. On top of that, in most states, a claim that stays medical-only, with no lost-time component, is reduced by 70% in the calculation. The practical takeaway is enormous: a high volume of small claims hurts you more than one large claim, and keeping a claim from ever becoming a lost-time claim earns a 70% haircut on its impact. Both of those outcomes are decided operationally, in the hours after an injury, not in your policy. Hold that thought, because it is the key to everything that follows.
The five variables that drive the spend
Workers’ comp cost is not a single number you negotiate. It is the product of five variables, and the defining feature of all five is that your response controls them, not your insurer. Let us take each in turn, because understanding them is what lets you target your effort where the money actually is.
Frequency
Frequency is how many of your injuries turn into claims, and it is the single most powerful lever you have, for a structural reason: the rating formula weights frequency more heavily than severity. Every claim generates a fully weighted primary loss, so ten small claims do more damage to your mod than one large one of equal total cost. The most recent industry data show that claim frequency is declining modestly year over year across the economy, which means an employer whose frequency is flat or rising is losing ground relative to the benchmark its EMR is measured against. Frequency is also the most controllable variable over time, because the majority of claims in physical industries come from a predictable, preventable source: musculoskeletal injuries from overexertion, lifting, and repetitive motion. Attack that source, and you pull primary losses out of your experience rating at the root.
Severity
Severity is how expensive each claim becomes, and it follows a brutal distribution. In most loss portfolios, a small fraction of claims drives the overwhelming majority of the cost. The most expensive claims, often involving lost time, surgery, and long recoveries, can cost many multiples of a routine claim and account for a disproportionate share of total disability weeks. The important insight is that severity is rarely fixed at the moment of injury. A strain that is well triaged and managed remains minor. The same strain, sent to an emergency room, left undiagnosed, or allowed to drift without a recovery plan, can escalate into exactly the kind of catastrophic-cost claim that dominates your spend. Severity is, to a large degree, a function of how the case is managed, not just how bad the original injury was.
Attorney involvement
Attorney involvement is the variable that turns a routine claim into an expensive one almost overnight. Research from the Workers’ Compensation Research Institute consistently finds that attorney involvement adds thousands of dollars in indemnity costs, dramatically extends lost-time duration, and multiplies claim expenses, with litigated claims commonly running close to four times the cost of comparable non-litigated claims. And the trigger for litigation is not greed. It is fear and confusion in the first hours after an injury: fear of being fired, the belief that a claim has been denied, the sense that no one believes the injury is real. A worker who is cared for immediately rarely reaches for a lawyer. One who is sent home to wait, with no contact and no information, often does.
Time to first treatment
Time to first treatment is the variable that sits upstream of the other four, because it is the cascade trigger. How fast an injured worker reaches appropriate clinical care determines the treatment path, the reporting speed, the worker’s trust in the process, and the start of the recovery timeline. The data on reporting lag alone is striking: claims reported about four weeks late can cost on the order of 45% more than those reported immediately, and even a one- to two-week delay measurably raises costs. Delay is not a neutral administrative gap. It is an active cost multiplier entirely within your control.
Return to work
Return to work refers to how quickly a recovering worker is back on suitable duty, and it governs the back half of a claim’s cost: indemnity payments and reserves. The research here is some of the most consistent in the field. Once a worker has been off the job for more than about twelve weeks, the likelihood they ever return to their original role drops to roughly half, and after a year out it collapses to a small fraction. Structured return-to-work programs, by contrast, have been shown to substantially reduce lost time and total claim costs by roughly 30%, with longer-term programs documenting even larger reductions in lost-time claims and total spend. A worker placed on modified duty quickly is a worker whose claim stays affordable.
Look across all five, and the pattern is unmistakable. Frequency, severity, litigation, treatment speed, and return-to-work are not set by your carrier. They are set by what your organization does in the hours and days after someone gets hurt. Which is precisely why the leverage point is so early.
Why most of the reduction happens in the first 30 minutes
Here is the thesis that reframes the entire problem. The bulk of your cost-reduction opportunity, on the order of 80% in our experience, is determined in the first 30 minutes after an incident. Not in the claims office weeks later. Not at renewal. At the point of injury.
The reason is mechanical, not motivational. The first contact after an injury sets the trajectory for all five variables at once, and once that trajectory is set, it is expensive and difficult to change. Walk through the cascade:
It decides the treatment path. A worker who reaches an appropriate clinician immediately is far more likely to be evaluated, reassured, and handled as a medical-only case. A worker sent to the emergency room by default starts down a far more expensive path, with higher facility costs, more imaging, more referrals, and a greater chance of escalation. Point-of-injury managed care commonly resolves a case for around $500, whereas an emergency-room-first response can run closer to $2,800 for a comparable injury. That is a five-to-one difference set in the first half hour, before anyone has filed anything.
It sets the reporting clock. Immediate clinical contact means immediate, accurate documentation. Every day of delay between injury and report raises cost, and the relationship is steep: a four-week lag can add roughly 45% to a claim. When the first response is a clinician, the report is contemporaneous, and the lag problem disappears.
It determines whether the worker trusts the process. Attorney involvement is driven by fear and confusion in the first hours, and immediate care defuses both. A worker who is examined and reassured does not sit at home assuming they are doubted, denied, or about to be fired. Attorney involvement climbs from around 13% for immediately reported claims to roughly 32% when reporting lags beyond 4 weeks. The first 30 minutes are where that fork is decided.
It starts the return-to-work timeline. The sooner accurate clinical restrictions are in place, the sooner a worker can be placed on modified duty, and the less indemnity and reserve will accumulate. A same-shift evaluation can be restricted at a supervisor’s discretion before the worker even goes home; a delayed process can cost days or weeks before anyone knows what the worker can safely do.
Every dollar of downstream cost is downstream of that first half hour. The claims office, the adjuster, the nurse case manager, the return-to-work coordinator: all of them are working with a trajectory that was largely set before they got involved. Which means if you want to cut costs, the point of injury is where you intervene. Everything else is damage control.
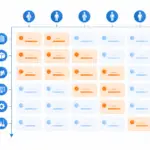
The intervention framework that HealthcareLive clients use
This is the operational system that turns the thesis into results. It has four components, and they are sequenced deliberately because each one amplifies the others.
Component 1: Put immediate clinical care at the point of injury
The foundation is same-shift clinical contact. The moment a worker is injured, they reach a qualified clinician, not hours or days later, but within minutes. HealthcareLive’s Remote Injury Care connects an injured worker to a board-certified occupational medicine clinician in under ten minutes, around the clock, in more than 300 languages. For employers with on-site coverage, On-Site Programs place an athletic trainer or clinician in the facility so the first contact is a few steps away.
This single change is the highest-leverage move in the entire framework because it operates within the exact 30-minute window when cost is determined and touches all five variables. It keeps cases medical-only, which earns the 70% rating reduction and avoids a fully weighted lost-time primary loss. It compresses reporting lag to near zero. It defuses the fear that drives litigation. And it produces accurate restrictions immediately, which starts the return-to-work clock. Ownership is simple: the clinical contact is the partner’s job, and the employer’s job is to make that contact the automatic, trained first step whenever an injury occurs, replacing the old default of “send them to the ER” or “fill out a form and wait.”
Component 2: Attack frequency with targeted prevention
The second component goes after the most heavily weighted cost driver: frequency. Because the majority of claims in physical industries are musculoskeletal, a prevention program that targets musculoskeletal risk addresses most of the problems. HealthcareLive’s Stretch & Flex program is built from each site’s own OSHA 300 log and job task analysis, so the conditioning is specific to the actual injuries the site is generating, not a generic routine. Delivered during the existing pre-shift window, it conditions workers for their specific job demands.
Across client programs, this has resulted in a 38-44% reduction in musculoskeletal claim frequency within the first 12 months. That frequency reduction is the engine behind the headline cost savings, because every prevented claim is a fully weighted primary loss that never enters your experience rating. Prevention is the slowest of the four components to mature, but it is the most durable, and within the rolling rating window, it compounds year over year.
Component 3: Compress severity with fast return to work
For the claims that do happen, the third component keeps them from becoming the expensive few that dominate your spend. Immediate clinical restrictions from Component 1 feed into a modified-duty program that gets recovering workers back on suitable tasks quickly, before the twelve-week cliff, when return becomes unlikely. This limits indemnity, holds reserves down, and prevents the slide into long-term disability. Virtual MSK care keeps recovery moving with structured therapy, so transitional duty is a short bridge rather than a long parking lot. The employer’s part is a prebuilt library of transitional tasks by role and restriction level, so that when restrictions are imposed, suitable work already exists, and the worker never has to sit idle at home.
Component 4: Protect your data
The fourth component is the one most employers neglect, and it quietly protects everything the other three earn. Accurate recordkeeping and case classification ensure your EMR and your OSHA submissions reflect reality. Done well, this means you neither over-record yourself into a higher mod nor under-record your way into a compliance problem, your medical-only claims are correctly captured so they earn their 70% reduction, and your experience rating worksheet is clean and disputable if the bureau has it wrong. Good data is not glamorous, but it is the difference between improvements that show up in your premium and improvements that get lost in bad paperwork.
How the four components compound
Run these together, and the math multiplies rather than adds. Lower frequency means fewer claims entering the system. Faster care means more of the claims that do happen stay cheap and medical-only. Better return-to-work means expensive claims are shorter and cost less. Cleaner data means your EMR finally reflects all that improvement, and your premium follows. Each component makes the others more effective, and the combined effect on total workers’ comp cost can reach 40% or more, none of which required changing your insurance carrier.
A worked example: running the dollars
Numbers make this concrete. Consider an illustrative 300-employee manufacturer, the kind of operation where this framework is a natural fit. Suppose the site runs 60 recordable injuries a year, of which 20 become lost-time claims, with an average total claim cost of $40,000 on the lost-time claims and far less on the medical-only ones, and an EMR of 1.15, which is adding a 15% surcharge to a sizable manual premium. Between direct claim costs and the premium surcharge, workers’ comp is a heavy and growing line on the budget, and leadership’s instinct is to shop the policy.
Now apply the framework. Immediate point-of-injury care keeps a meaningful share of injuries that would otherwise have become lost-time claims, and the ones that do become lost-time are reported instantly and returned to modified duty faster, cutting their average cost. Targeted prevention reduces musculoskeletal frequency by the documented 38 to 44%, so over the first year, the 60 injuries trend toward the high 30s, and the lost-time count falls with it. Cleaner data ensures every medical-only case earns its 70% rating reduction, and the mod reflects the lower, less frequent loss picture.
The compounding effect is what produces the headline. Fewer claims, more of them medical-only, the serious ones shorter and cheaper, and a mod that drops as the improved years roll into the three-year window. A reduction of nearly 40% in total workers’ comp costs is a realistic target for a site like this over the first year or two, with the EMR improvement continuing to develop as the rating window catches up. The premium negotiation that leadership wanted to lead with turns out to be the smallest line in the analysis. The largest, by far, is the first 30 minutes.
This is exactly the kind of calculation the accompanying cost model is built to run on your own numbers.
The cost model: run your own figures
Because every operation is different, the savings are best seen in your own data. The downloadable cost model that accompanies this framework lets you plug in your headcount, your annual claim count, your average claim cost, and your current EMR, and then model the impact of three changes: reducing claim frequency, converting cases to medical-only through immediate care, and shortening lost time through return to work. It outputs projected dollar savings and an estimated EMR effect in a format designed for EHS managers, HR directors, and CFOs to share and defend.
The point of the model is not a single magic number. It is to show, in your own figures, where the cost actually sits and how much of it is recoverable through operational change rather than a new policy. For most employers, the result reframes the entire conversation: the recoverable savings dwarf anything a renewal could deliver, and they sit in parts of the operation the finance team did not realize it controlled.
Making the case internally
The deck named three audiences: EHS managers, HR directors, and CFOs, because cutting workers’ comp costs is a cross-functional effort, and each of those roles has to be brought along in its own language.
For the EHS manager, this framework is a safety win first and a cost win second. Fewer injuries and faster, better care for the ones that happen is the core of the job. The frequency reduction and the point-of-injury care model are the parts that resonate, and the recordkeeping component directly improves the OSHA metrics on which EHS is measured.
For the HR director, the story is about people and risk. An immediate, caring clinical response is a powerful signal of how the company treats its workforce; it reduces the litigation that consumes HR’s time, and the return-to-work program keeps valuable employees attached to the organization rather than drifting into long-term disability. The framework reduces both human and legal exposure at once.
For the CFO, the argument is pure financial logic. Premium is a function of loss history, loss history is operational, and the model quantifies a recoverable cost that shopping the policy cannot touch. The CFO cares that the savings are durable, that they show up in the EMR over a predictable timeline, and that the investment in the program is small relative to the loss reduction it produces. Frame it as moving spend from an uncontrollable line, claim costs, to a controllable one, prevention and early care, with a clear return.
The internal pitch that works is the one that unifies these: this is simultaneously a safety improvement, a workforce-trust improvement, and a cost reduction, and it is achieved operationally, without the disruption of changing carriers.
Download the deck
An implementation timeline
A realistic rollout has three horizons.
The first 30 days are about standing up the point-of-injury response: establishing the same-shift clinical contact, training supervisors to make it the automatic first step, and replacing the old default of the emergency room or the wait-and-file process. This is the highest-leverage change, and it can be live quickly.
The first 90 days add the return-to-work infrastructure, building the transitional-duty task library by role and restriction level so that when restrictions arrive, there is always suitable work, and tightening the recordkeeping process so the data is clean from the start.
The first 12 months are where prevention matures. The targeted conditioning program drives frequency down across the year toward the documented 38 to 44% range, and as the improved loss experience accumulates, it begins feeding into the experience rating window. The full effect on the EMR and premium continues to develop over the next one to two years because the rating formula looks back over multiple years. The point is that the operational gains start immediately, and the financial gains compound on top of them.
The bottom line
If your workers’ comp costs are too high, the answer is almost certainly not to switch carriers. Your premium is a mirror of your losses; your losses are determined operationally, and the decisive moment is the first 30 minutes after an injury, when an injured worker either receives immediate, expert, caring clinical contact or is sent home to wait. Change that one thing, attack frequency with real prevention, return people to work quickly, and keep your data clean, and a 40% cost reduction is within reach without ever opening a renewal. The premium negotiation you were about to lead with is the smallest lever in the system. The biggest is sitting on your own floor. If you want to see what this framework would do to your numbers, HealthcareLive can help you build the model and the program behind it.
Frequently asked questions
Can I really cut workers’ comp costs without changing insurance carriers? Yes, and for most employers, it is the more effective path. Your premium is largely a function of your loss history, reflected in your Experience Modification Rate, and a new carrier inherits that history. Reducing your actual losses through better injury response, prevention, and return-to-work lowers your costs regardless of who underwrites the policy.
Why do the first 30 minutes after an injury matter so much? Because the first clinical contact sets the trajectory for every major cost driver at once: whether the case stays medical-only or escalates, how quickly it is reported, whether the worker trusts the process or hires an attorney, and when return-to-work planning can begin. Decisions made downstream have far less leverage than the ones made at the point of injury.
What are the five variables that drive workers’ comp costs? Claim frequency, claim severity, attorney involvement, time to first treatment, and return to work. All five are controlled by how an organization responds to injuries, not by its choice of insurance carrier.
What is the 38 to 44% figure based on? That range reflects the reduction in musculoskeletal claim frequency that HealthcareLive clients have achieved within 12 months using a targeted prevention program built from their own injury data. It is a HealthcareLive program outcome; individual results vary by industry, workforce, and the extent to which the program is implemented.
Won’t reducing claims just mean my carrier keeps the savings? No. Lower losses flow directly into your Experience Modification Rate, which lowers your premium at renewal regardless of carrier. The savings accrue to you because the EMR is calculated from your own loss history. The effect builds over the rating window rather than appearing all at once.
Does this require me to buy anything from my insurance company? No. The framework is operational and runs through an occupational health partner and your own internal process changes. It is independent of your insurance policy, which is precisely why it works without changing carriers.
How quickly can we expect to see savings? Some effects are immediate, such as keeping new claims medical-only and promptly reporting them. Frequency reductions typically build over the first year, and because the experience rating uses a multi-year window, the full effect on your EMR and premium continues to develop over the following 1 to 2 years.
Who should own this internally? It works best as a shared effort: EHS owns prevention and the point-of-injury response, HR owns the people and return-to-work side, and finance owns the cost modeling and the business case. A clear owner for each component, with leadership backing, is what turns the framework from a good idea into results.
Sources and methodology
This article builds on workers’ comp cost research from the National Council on Compensation Insurance (NCCI) on claim frequency, severity, and reporting lag; the Workers Compensation Research Institute (WCRI) on attorney involvement and its cost impact; the American College of Occupational and Environmental Medicine on return-to-work likelihood over time; carrier and industry data on return-to-work savings and on the cost difference between point-of-injury managed care and emergency-room-first response; and the experience-rating mechanics that tie premium to loss history, including the primary and excess loss split and the 70% medical-only reduction used in most states. Specific figures vary by state, industry, and claim mix.
The framing that roughly 80% of cost-reduction opportunities are determined in the first 30 minutes is a directional representation of how point-of-injury decisions cascade across the five cost variables, not a single externally published statistic. The worked example is illustrative and uses round numbers to demonstrate the method, not a specific client. The 40% total cost reduction is presented as an achievable target for employers who implement the full framework, and the 38 to 44% claim frequency reduction reflects HealthcareLive client outcomes within 12 months; both reflect HealthcareLive program data and network experience and will vary by implementation. The accompanying cost model is a planning tool and produces estimates, not guarantees.